A consensus function can introduce redundancy and foster robustness when, instead of choosing or fine-tuning a single clusterer, an ensemble of clusterers is employed and their results are combined. This is particularly useful when clustering has to be performed in a closed loop without human interaction. The goal of Robust Centralized Clustering (RCC) is to do well for a wide variety of data distributions with a fixed ensemble of clusterers.
In RCC, each clusterer has access to all features and to all
objects. However, each clusterer might take a different approach. In
fact, approaches should be very diverse for best results. They
can use different distance/similarity measures (e.g., Euclidean,
cosine) or techniques (graph-based, agglomerative, ![]() -means)
(see chapter 4). The ensemble's clusterings are then integrated using
the consensus function
-means)
(see chapter 4). The ensemble's clusterings are then integrated using
the consensus function ![]() without access to the original
features.
without access to the original
features.
To show that RCC can yield robust results in low-dimensional metric spaces
as well as in high-dimensional sparse spaces without any
modifications, the following experiment was set up.
First, 10 diverse clustering algorithms were implemented: (1) self-organizing
map; (2) hypergraph partitioning; ![]() -means with distance based on (3)
Euclidean, (4) cosine, (5) correlation, and (6) extended Jaccard; and
graph partitioning with similarity based on (7) Euclidean, (8) cosine,
(9) correlation, and (10) extended Jaccard. Implementational details of
the individual algorithms can be found in chapter 4.
-means with distance based on (3)
Euclidean, (4) cosine, (5) correlation, and (6) extended Jaccard; and
graph partitioning with similarity based on (7) Euclidean, (8) cosine,
(9) correlation, and (10) extended Jaccard. Implementational details of
the individual algorithms can be found in chapter 4.
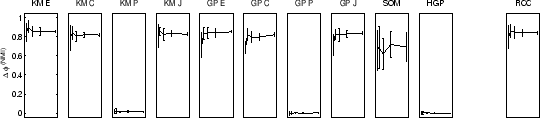
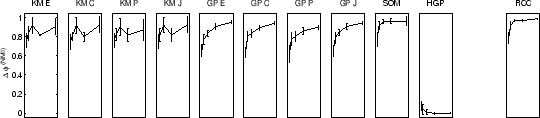
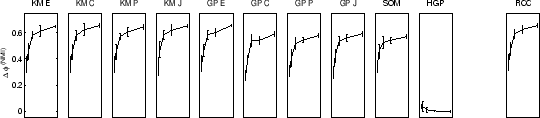
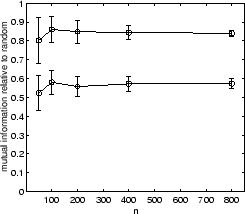
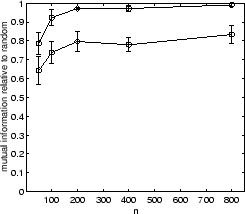
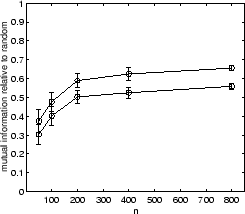
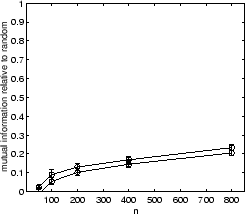
RCC was performed 10 times each on sample sizes of 50, 100, 200, 400, and 800, for each data-set. Different sample sizes provide insight how cluster quality improves as more data becomes available. Quality improvement depends on the clusterer as well as the data. For example, more complex data-sets require more data until quality maxes out. We also computed a random clustering for each experiment to establish a baseline performance. The quality in terms of difference in mutual information as compared to the random clustering algorithm for all 11 approaches (10 + consensus) is shown in figure 5.7. Figure 5.8 shows learning curves for the average quality of the 10 algorithms versus RCC.
In figure 5.7(top row) the results for the
2D2K data using ![]() are shown.
From an external viewpoint, the consensus function was given seven
good (Euclidean, cosine, and extended Jaccard based
are shown.
From an external viewpoint, the consensus function was given seven
good (Euclidean, cosine, and extended Jaccard based ![]() -means
as well
as graph partitioning,
and self-organizing feature-map)
and
three poor (hypergraph partitioning, correlation based
-means
as well
as graph partitioning,
and self-organizing feature-map)
and
three poor (hypergraph partitioning, correlation based ![]() -means, and
correlation based graph partitioning) clusterings.
At sample size of
-means, and
correlation based graph partitioning) clusterings.
At sample size of ![]() , the RCC results are better than all
individual algorithm quality evaluations. There is no noticeable
deterioration caused by the poor clusterings. The average RCC
quality at 0.85 is 48% higher than the average quality of
all individual algorithms (excluding random) at 0.57.
, the RCC results are better than all
individual algorithm quality evaluations. There is no noticeable
deterioration caused by the poor clusterings. The average RCC
quality at 0.85 is 48% higher than the average quality of
all individual algorithms (excluding random) at 0.57.
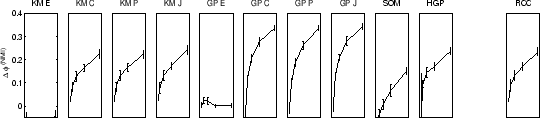
In case of the YAHOO data (figure 5.7(bottom
row)) the consensus function
received three poor clusterings (Euclidean based ![]() -means as well as
graph partitioning; and self-organizing feature-map5.10),
four good (hypergraph partitioning,
cosine, correlation, and
extended Jaccard based
-means as well as
graph partitioning; and self-organizing feature-map5.10),
four good (hypergraph partitioning,
cosine, correlation, and
extended Jaccard based ![]() -means) and three excellent (cosine,
correlation, and extended Jaccard based graph partitioning)
clusterings.
The RCC results are almost as good as the average of
the excellent clusterers despite the presence of distractive
clusterings.
In fact, at the
-means) and three excellent (cosine,
correlation, and extended Jaccard based graph partitioning)
clusterings.
The RCC results are almost as good as the average of
the excellent clusterers despite the presence of distractive
clusterings.
In fact, at the ![]() level, RCC's average
quality of 0.38 is 19% better than the average qualities of all the other algorithms (excluding random) at
0.32. This shows that for this scenario, too, cluster ensembles
work well and also are robust!
level, RCC's average
quality of 0.38 is 19% better than the average qualities of all the other algorithms (excluding random) at
0.32. This shows that for this scenario, too, cluster ensembles
work well and also are robust!
Similar results are obtained for 8D5K and PENDIG. In these two cases all individual approaches work comparably well except for hypergraph partitioning. The supra-consensus function learns to ignore hypergraph partitioning results and yields a consensus clustering of good quality.
Figure 5.8 shows how RCC is consistently better in all four scenarios than picking a random / average single technique. Looking at the three consensus techniques, the need for all of them becomes apparent since there is no ubiquitous winner. In 2D2K, 8D5K, and PENDIG, MCLA generally had the highest ANMI, followed by CSPA, while HGPA performed poorly. In YAHOO, both CSPA and HGPA, had the highest ANMI approximately equally often, while MCLA performed poorly. We believe this is due to the fact that there was higher diversity in YAHOO clusterings and CSPA and HGPA are better suited for that because no cluster correspondence is assumed.
The experimental results clearly show that cluster ensembles can be used to increase robustness in risk-intolerant settings. Especially, since it is generally hard to evaluate clusters in high-dimensional problems, a cluster ensemble can be used to `throw' many models at a problem and then integrate them using an consensus function to yield stable results. Thereby the user does not have to have, e.g., category labels to pick a single best model. Rather the ensemble automatically `focuses' on whatever is most appropriate for the given data. In our experiments, there is diversity as well as some poorly performing clusterers. If there are diverse but comparably performing clusterers, the quality actually significantly outperforms the best individual clusterer, as we will see in the next section.
|
|